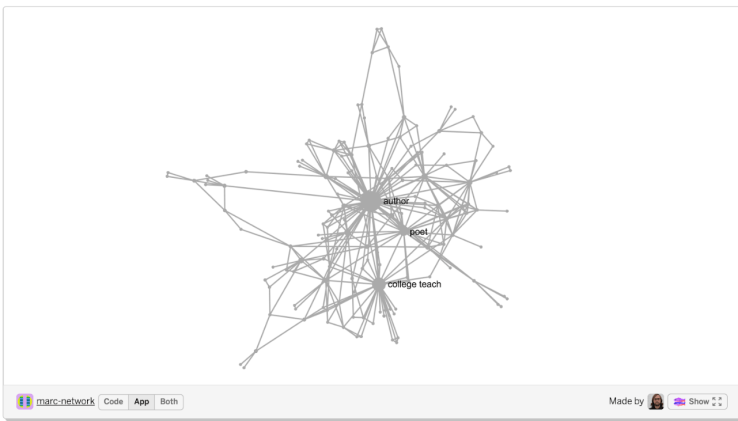
For this week’s homework, we’re building off of the MARC template overviewed in class to create investigative “excavations” of the Library of Congress’ digital archive via the MARC records . How can we reveal something new to us and others through these new connections? We talked about about nodes and edges via graph theory, and apply that sort of thinking to the MARC records using Sigma.js + Node.js.
How do we get from looking at Marc to some interesting computational questions? In class we took a look at 4 sort of methodical approaches to take/ think about when approaching a collection: composition, comparison, distribution, and relation. We also talked about approaching the process in different ways, like from the view of traditional archeological excavations/digs and their fieldnotes. How can we borrow that sort of dissection and physical representation of process & data to our MARC explorations?


MARC Parser / LOC Authority Record
First off, what does a LOC name authority record look like? What is its role?
- npm install
- npm run download – data
- Node network.js
- Head (drag and drop folder)
- can also id how many lines you’d like
- Head -500
- Copy in file
- can also id how many lines you’d like
We used Head -500 as a way to receive the first 500 lines of a file. This is also a really great way to subset a large CSV file. The way we request data is similar to last class, we used a MARC parser.
- ex: Marc Parser
How we’re using the MARC Parser
- building networks between the data stored within the 3 tags
- always good to ask critical question about how these categorizations are made like ‘residence place’ vs ‘otherplace’
- How are *record.Occupation* & *record.Birthplace* working?
- record.Occupation is similar to how our animals are working
- we used a stemmer in last class that takes a word and shortens it to its most convenient root
- ex: composer = compos or illustrator = illustr
- always good to note also what corpus a stemmer is trained on
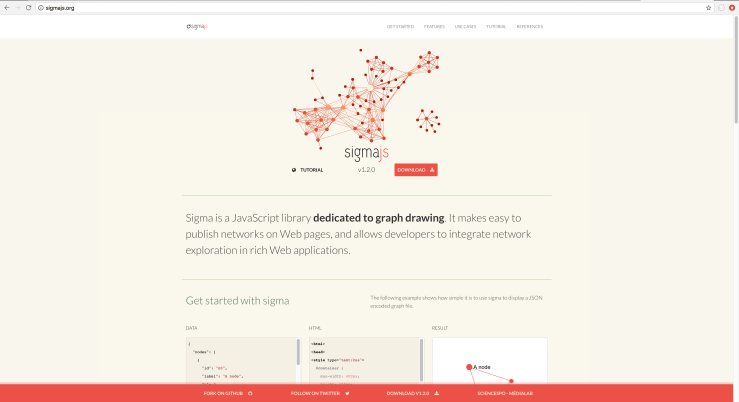
Sigma.js
- Sigma is a little better for networks since that’s all it does
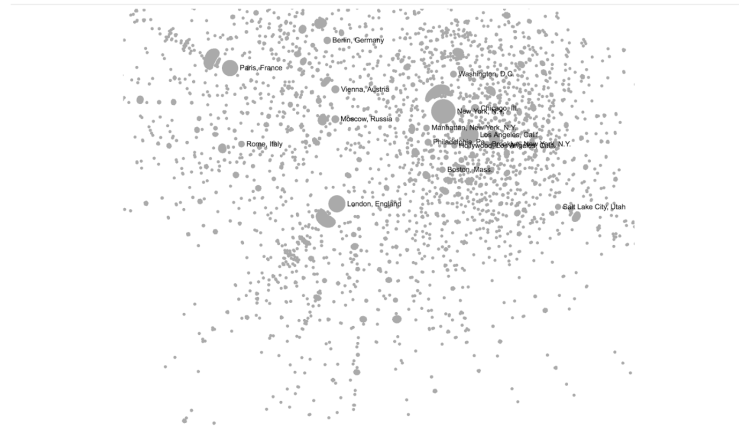
- D3 can be good for maps

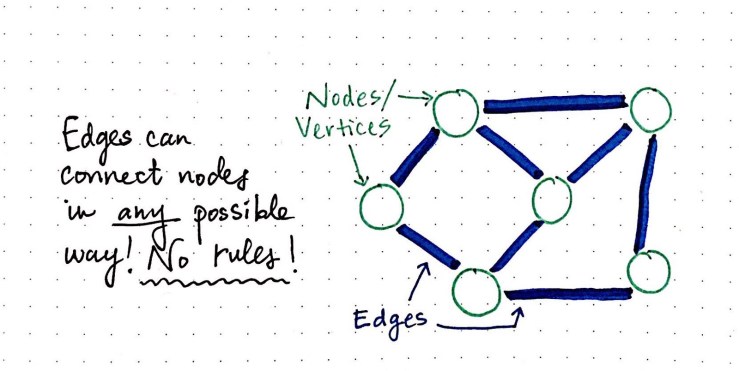
Nodes & Edges
Nodes, edges, weighted
- nodes do have size
{ nodes: [
{id: },
{id: }
],
edges:[
{id:______, source:, target:}
]
}
Good to ask:
- What is the network I’m building?
- And what is its location?
- ex: do i have a network object for this thing? If not, then lets make one.
- Make node object for each item
- Assign:
- id
- label
- random x,y position
- And then edge objects to connect those two things together
- Assign:
Occupation_network.json (open it up to see how its working)
- Add Occupation_network.json to glitch sketch
- Add as public/Occupation_network.json
Edit name in parser to match new added file (public/)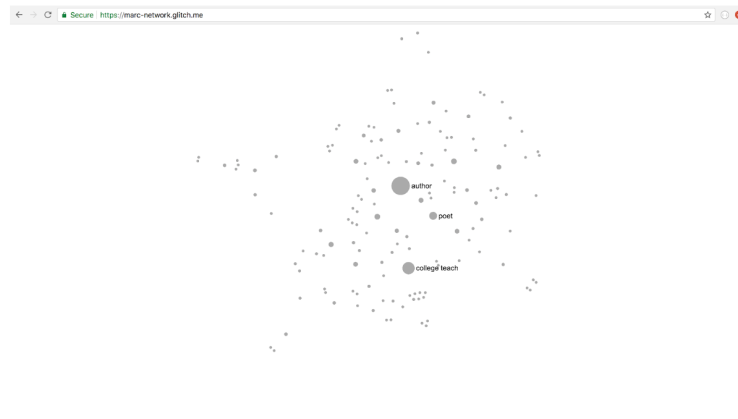
How do you take these renderings to make sure they display the info in a meaningful way for others? in a way that they can parse from the outside as well?
Anytime we see 2 pieces of data we can visualize a connection:
- That connection tells us often something new about the data
- Example thinking about the animal corpora = how we could find animals that might be most commonly photographed together
Commonly used in linguistics
-
Word2vec is a group of related models that are used to produce word embeddings. These models are shallow, two-layer neural networks that are trained to reconstruct linguistic contexts of words. Word2vec takes as its input a large corpus of text and produces a vector space, typically of several hundred dimensions, with each unique word in the corpus being assigned a corresponding vector in the space. Word vectors are positioned in the vector space such that words that share common contexts in the corpus are located in close proximity to one another in the space.[1]
Thinking about Marc – How do you come up with ideas?
- How do I get from looking at Marc to get to some computational questions?
- Learning the skill of how to frame a question, so you know how to slightly alter it:
- Ex: once you’ve searched for animals? Then you can search for other terms
2 things to consider:
- What aspects of the example code functions as modular legos that can switch out / can be manipulated?
- What are the larger interrogations of the archive that we’re interested in?
4 Questions / Parts:
- Composition
- Comparison
- Distribution
- Relation
1. Composition

- what is the balance of things in this composition?
- ex: in the Marc Record = what are the split of languages or countries?
- Helps us to think about how we might begin to frame it
- ex: When Catalina from Hispanic collections asked: “whats the language composition of this?”
- ex: Languages, countries
- More of a map sense / a sense of a whole
2. Comparison

- more of a bar chart ex
- how many cats verses jobs
- not a sense of a whole, hard to visualize a pie chart of the data
- ex: gender, etc.
3. Distribution

- What is the pattern?
- Think of a common bellcurve
- What is the pattern of how things are distributed
- Think abt Power law distribution Curve (ex: bell curve)
- Similar to distribution but tells us something a little bit more specific
- Ex: how many people in the class would eat popcorn every week
4. Relation

Homework:
Work with Marc records and see if you can uncover something using the MARC template. You can use the subject records, prints and photographs, maps, music, etc
Pick one item thats getting you excited, start asking some questions, and then apply one of the templates we’ve reviewed as a way to find out a little bit of information. If you don’t have a file you can send a pdf walking through your efforts/
Wants a photograph, a field-note, or an oral history of something you discovered


Various Resources
-
Dif between var vs let vs const
-
Variable Declaration vs Initialization
-
Scope (global & function), Hoisting
-
Curl & Wget
